Parametric Optimization for Medical Devices
Nasal inhalers are widely used medical devices designed to deliver a predefined dose of medication into the nasal cavity. Often, the drug is in liquid form and is atomized into fine droplets before being released. To be effective, these droplets must adhere to and penetrate the mucosal surface of the nasal cavity.
The amount of medicine that is actually delivered to the patient, meaning the quantity that sticks to the mucosa, is a critical performance indicator. Achieving optimal deposition is challenging due to the number of influencing parameters: patient-specific nasal morphology, nozzle geometry, injection velocity, device alignment and positioning, droplet size distribution, and timing of injection relative to the respiratory cycle.
Traditionally, this complexity has been addressed through physical experiments, such as clinical trials or injection tests in hand-crafted prototypes replicating the nasal structure. However, these methods pose several limitations, including high costs, lack of repeatability, and patient safety concerns.
A powerful alternative lies in virtual simulation. Using physics-based models, it is possible to replicate the behavior of airflow and dispersed particles within a computational domain, providing detailed insights at every timestep and location.
This project showcases the application of PhyMo to simulate nasal inhaler performance. Patient-specific CAD models of nasal cavities are used to compute drug deposition levels for a given dosage, and to optimize outcomes with respect to droplet size and injection angle.
Although the full study remains confidential, a representative result is shown on this page. It clearly demonstrates the value of this approach in improving the design and performance of medical devices through simulation-driven development.
MRI-based, patient-specific, nasal cavity CAD model
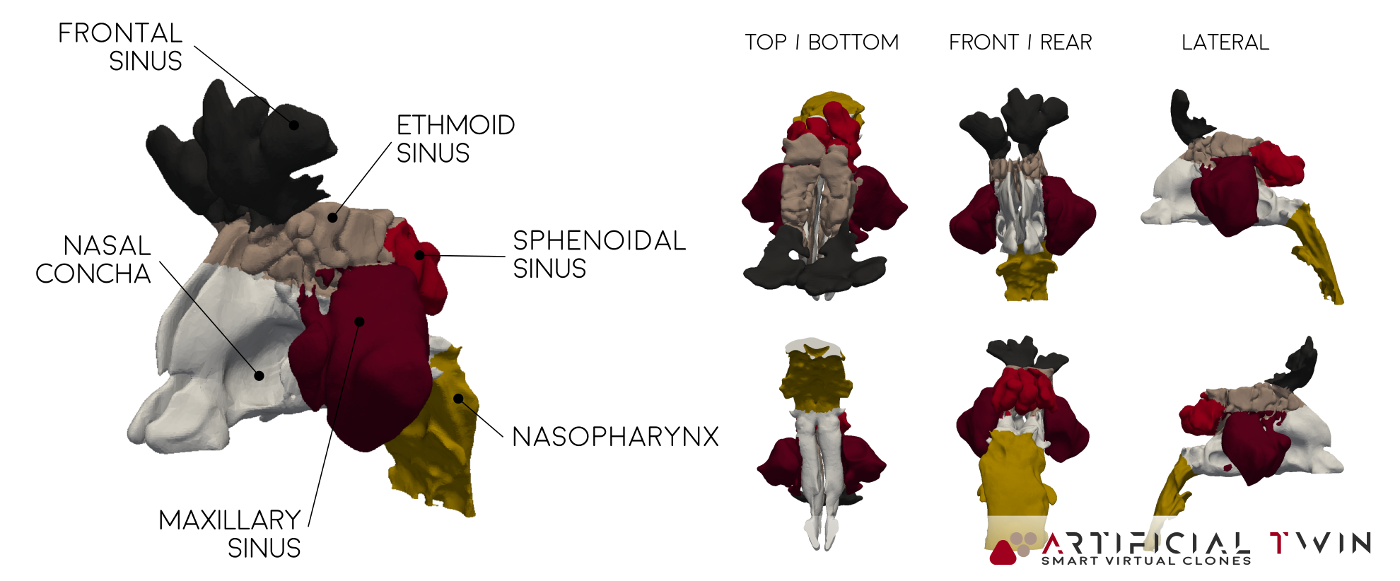
To run simulations of airflow and drug delivery inside the nasal cavity, a detailed 3D CAD model of the internal anatomy is required. Creating this model involves a multi-step process. First, a high-resolution MRI scan is performed, generating a stack of cross-sectional images. These are then processed using dedicated software to reconstruct a continuous three-dimensional geometry.
The resulting model, used in the simulations presented on this page, accurately reflects the anatomical features of the nasal cavity. Colored regions in the image above distinguish different zones within the cavity. This segmentation is carried over into the simulation, allowing zone-specific analysis of drug deposition, which provides deeper insight into the delivery process.
One final detail: before simulation, the CAD model typically undergoes adjustments near the nostrils to account for the inhaler’s geometry. This step ensures that flow interactions near the inlet boundary, often modeled as a spherical surface a few centimeters across, are represented with high fidelity.
Simulation Pt 1: Airflow Analysis
With the CAD ready, the complete simulation workflow can begin. It is divided into two conceptually independent parts: one for the airflow and one for the particles.
The very first step is the creation of the computational grid: the domain is discretized into small elements, called cells, where all variable values are calculated. PhyMo provides a very robust meshing tool, capable of effectively handling very complex geometries, such as this one.
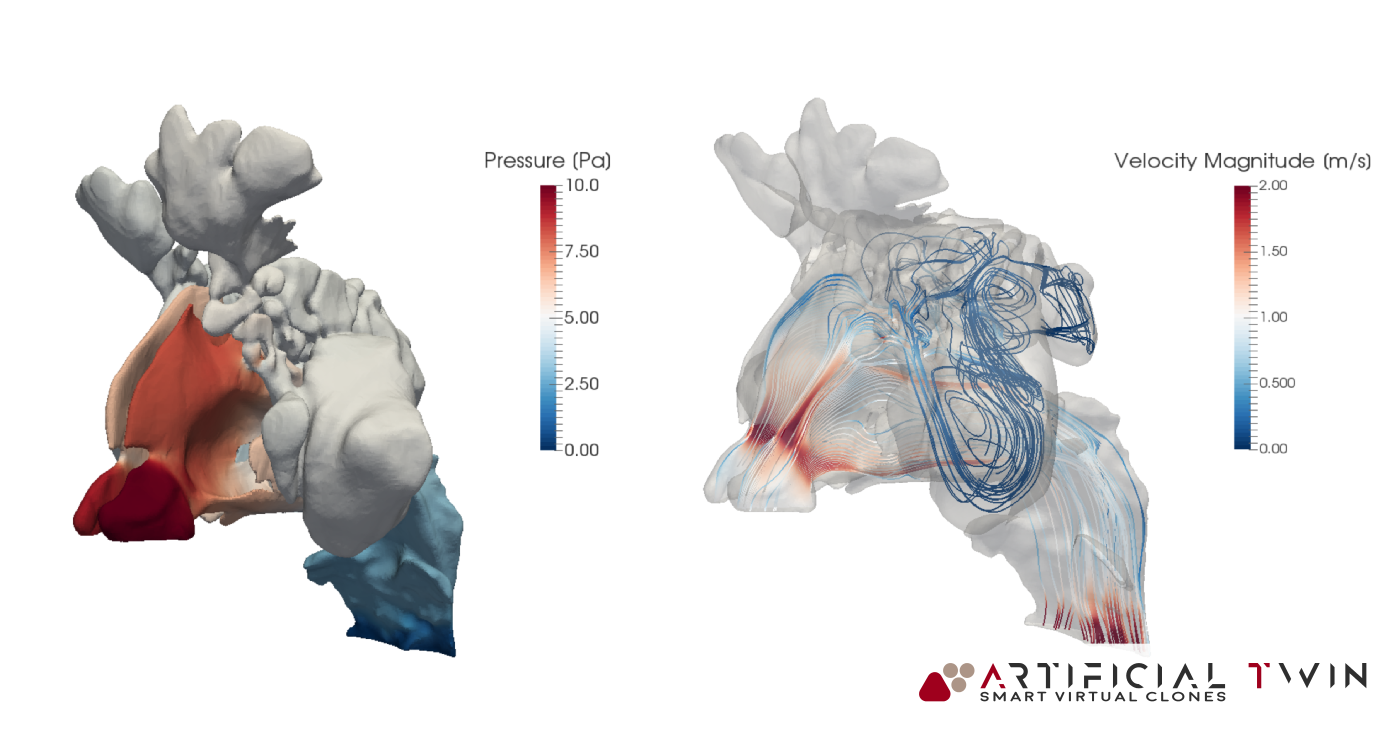
The first simulation part focuses on airflow, it calculates all fluid dynamics variables like pressure, velocity, and turbulence, based on imposed boundary conditions. Results shown here correspond to a steady 5-second inhalation. With proper setup, transient flows (like a full breathing cycle) can also be modeled.
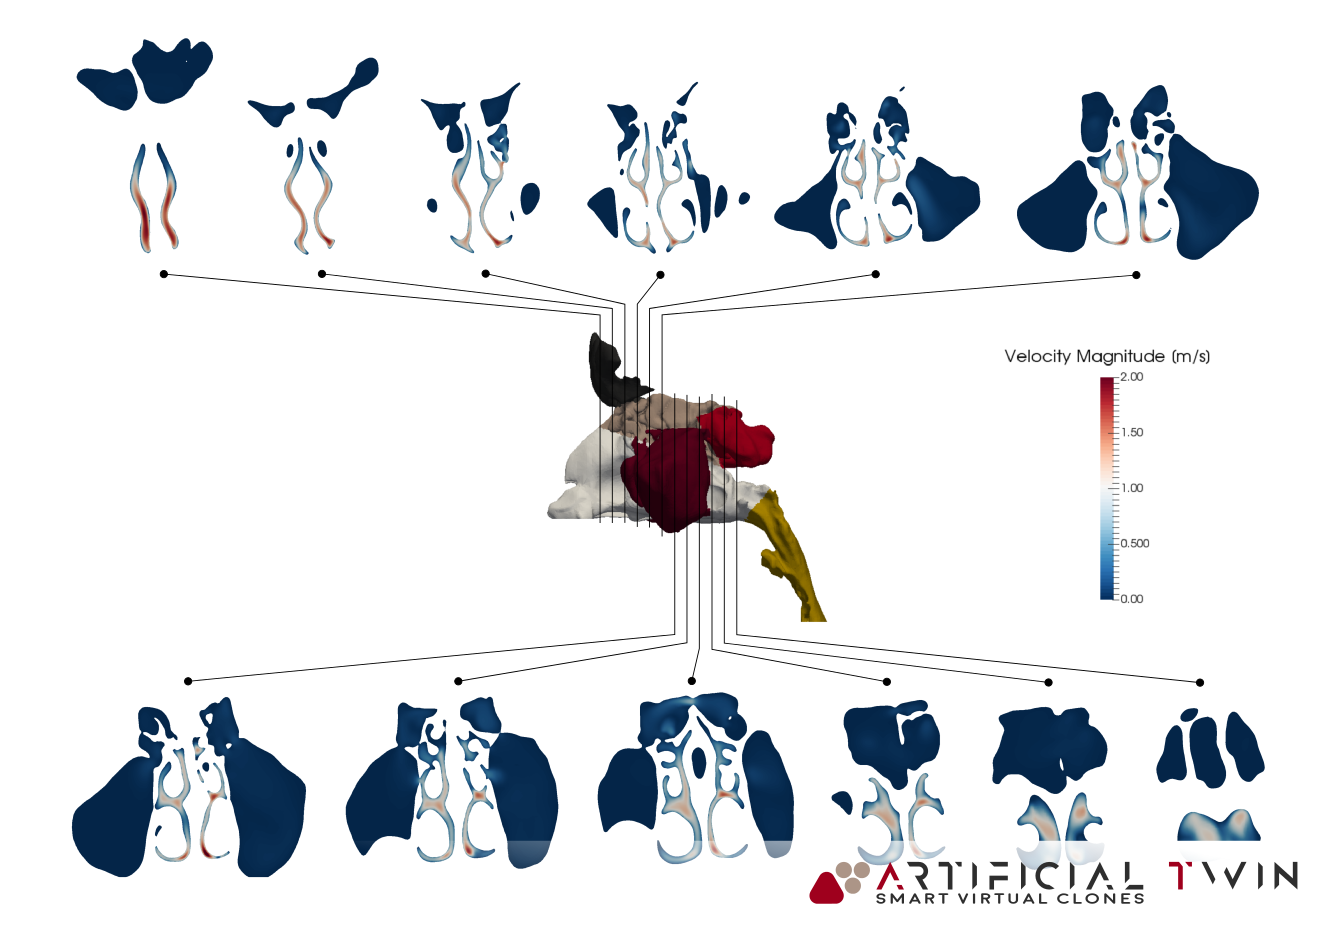
In the images above and on the left, you can see typical insights gained from this phase of the analysis: pressure distributions on nasal cavity walls and flow lines (above) provide 3D information, highlighting areas where narrow passages increase velocity and create high- and low-pressure zones. Nasal cavity sections (left) show a set of 2D velocity magnitude contour maps, capturing detailed flow behavior across twelve equally spaced domain slices.
Simulation Pt 2: Drug Particles
The second part of the simulation concerns the motion of dispersed particles. This advanced functionality of PhyMo takes specific inputs, such as injected mass, droplet size (mean and distribution type), and density, and computes the trajectory for each particle. Their paths depend on local flow velocity, aerodynamic forces, gravity, and collisions with surfaces or other particles.
Injection can be defined in many ways, from manually specified positions to surface- or cone-shaped bounded distributions. Additional parameters include injection velocity, duration, and mass flow. The results shown were obtained using a surface-related injection at 1 m/s over 0.2 seconds.
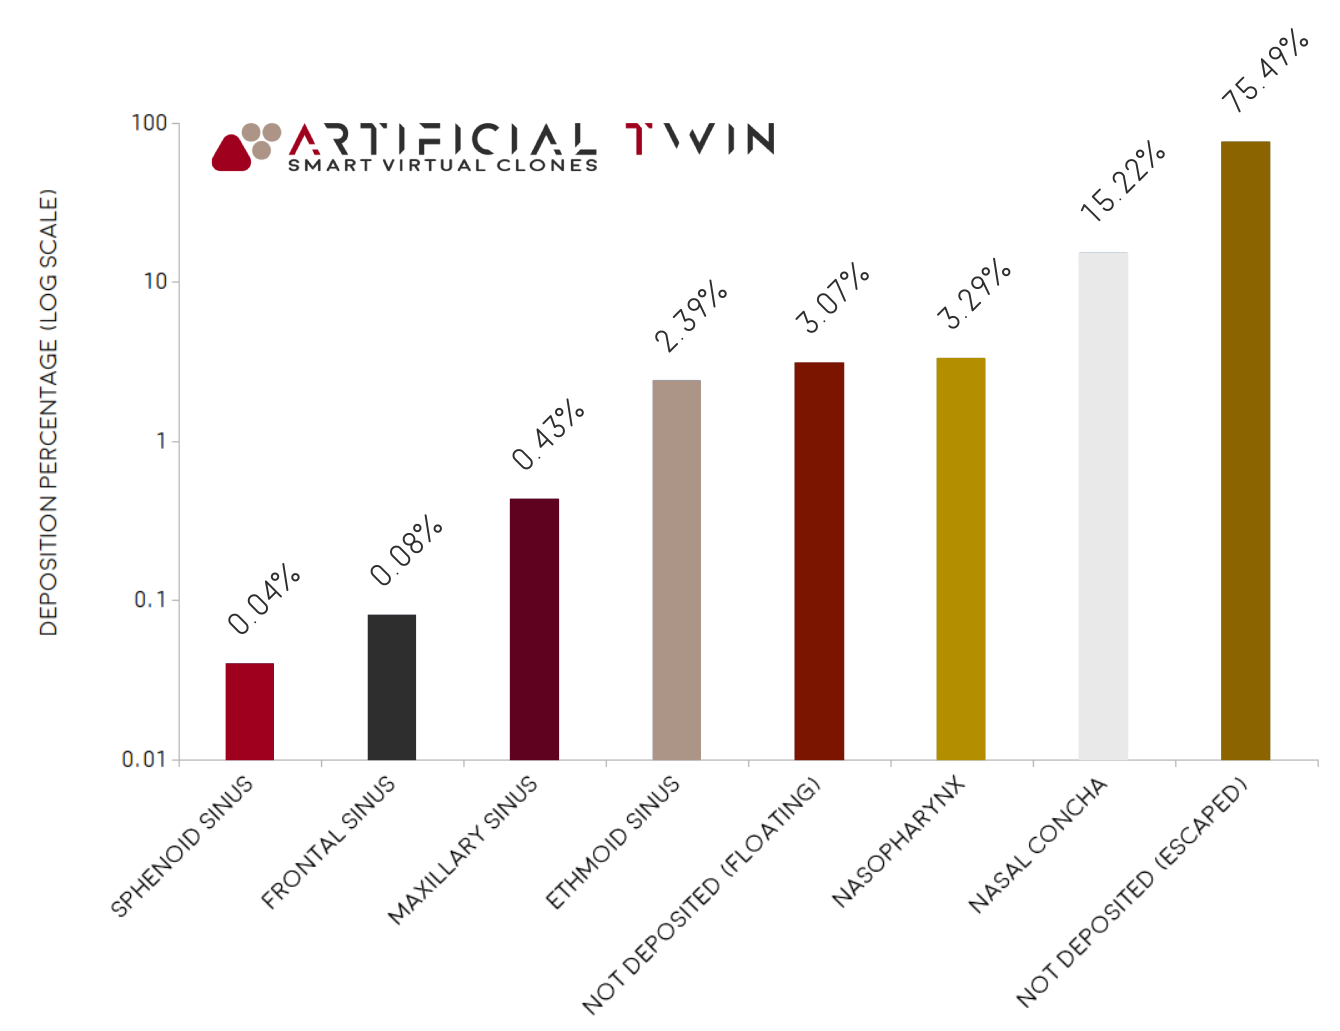
Walls are defined as sticky (where particles adhere), except for inlet and outlet boundaries, which allow exit. The chart on the right shows the final mass distribution: ~22% deposited, ~75% exited the domain, and ~3% remained suspended. The deposited portion is further broken down by zone, with ~15% settling on the nasal concha, ~3% on the nasopharynx, and ~2% on the ethmoid sinus.
A Complex Optimization Problem
The video on the left illustrates the full animation of particles traveling through the nasal cavity. Particles that adhere to surfaces are shown in blue, while floating ones are red. This visual insight helps qualitatively assess deposition zones, data that is nearly impossible to gather experimentally.
This type of analysis is highly complex and influenced by many parameters. In this particular case, optimizing drug deposition required the consideration of numerous variables, creating a high-dimensional optimization problem.
Virtual simulations like these provide insights otherwise unattainable. In medical device design and many other fields, they serve as critical tools to guide engineering intuition and enable virtually-tested, optimized solutions.