Understanding complex flow patterns
The drilling industry operates in extremely harsh environments, making optimal equipment design critical. Proper design ensures not only operational reliability but also influences process performance metrics such as drilling speed.
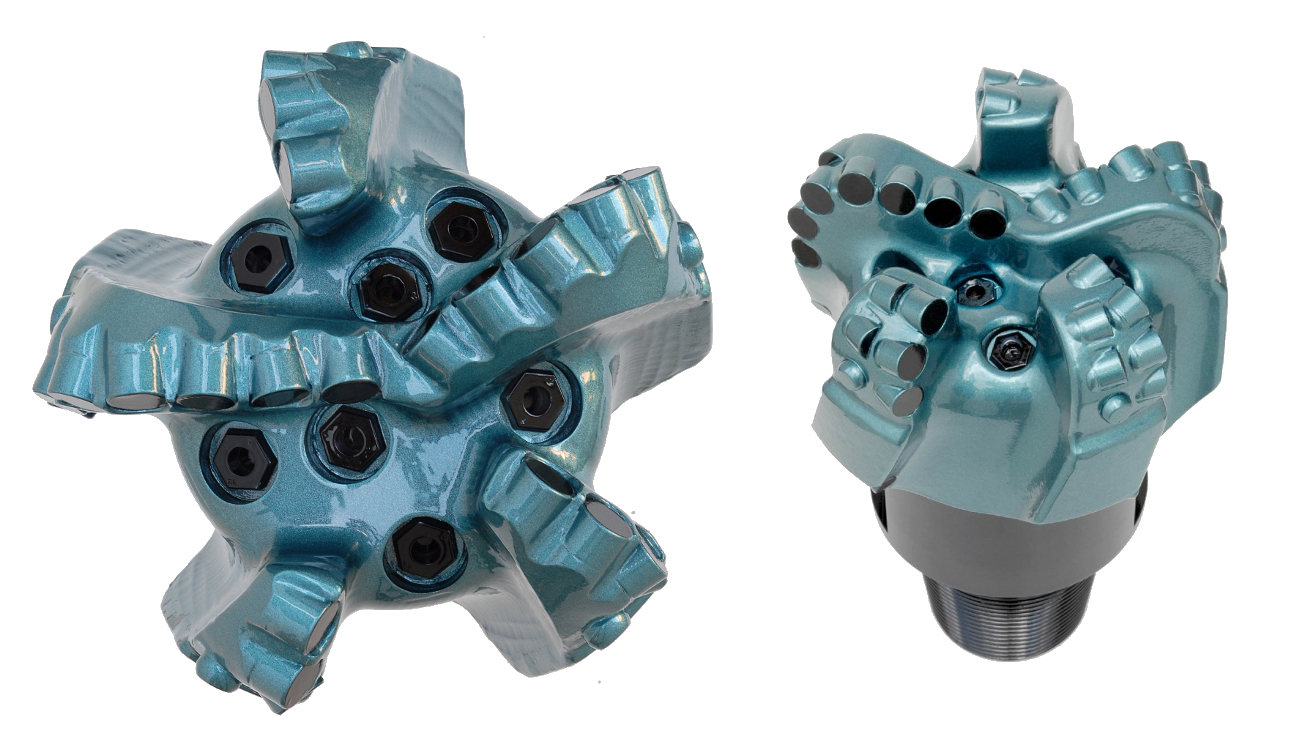
This project focuses on the flow around a drill bit, composed mainly of cutting elements and fluid nozzles. The fluid injected through the nozzles serves to remove rock fragments generated by the cutting elements. Factors such as nozzle positioning, fluid velocity, and cutting element layout strongly affect this removal efficiency.
PhyMo enables virtual simulations that provide designers with accurate insights into flow behavior. In this case, it was used to evaluate and compare different drill bit designs based on their flow performance.
Analysis description
The first step in analyzing alternative designs is producing a virtual 3D model (CAD) for each variant, usually in neutral formats such as STEP, IGES, or STL.
Next comes the meshing phase, where the computational domain is discretized. High-quality meshes are crucial for reliable simulation results. Our expertise combined with PhyMo’s advanced meshing capabilities ensures robust mesh generation.
Finally, boundary conditions are assigned to define the problem uniquely: fluid velocity at the inlet, pressure at the outlet, and no-slip walls on physical surfaces. The solver then iteratively computes the solution, which is saved for performance evaluation and design comparison.
Results visualization
Visualization is key to understanding simulation results. Here are three typical techniques used:
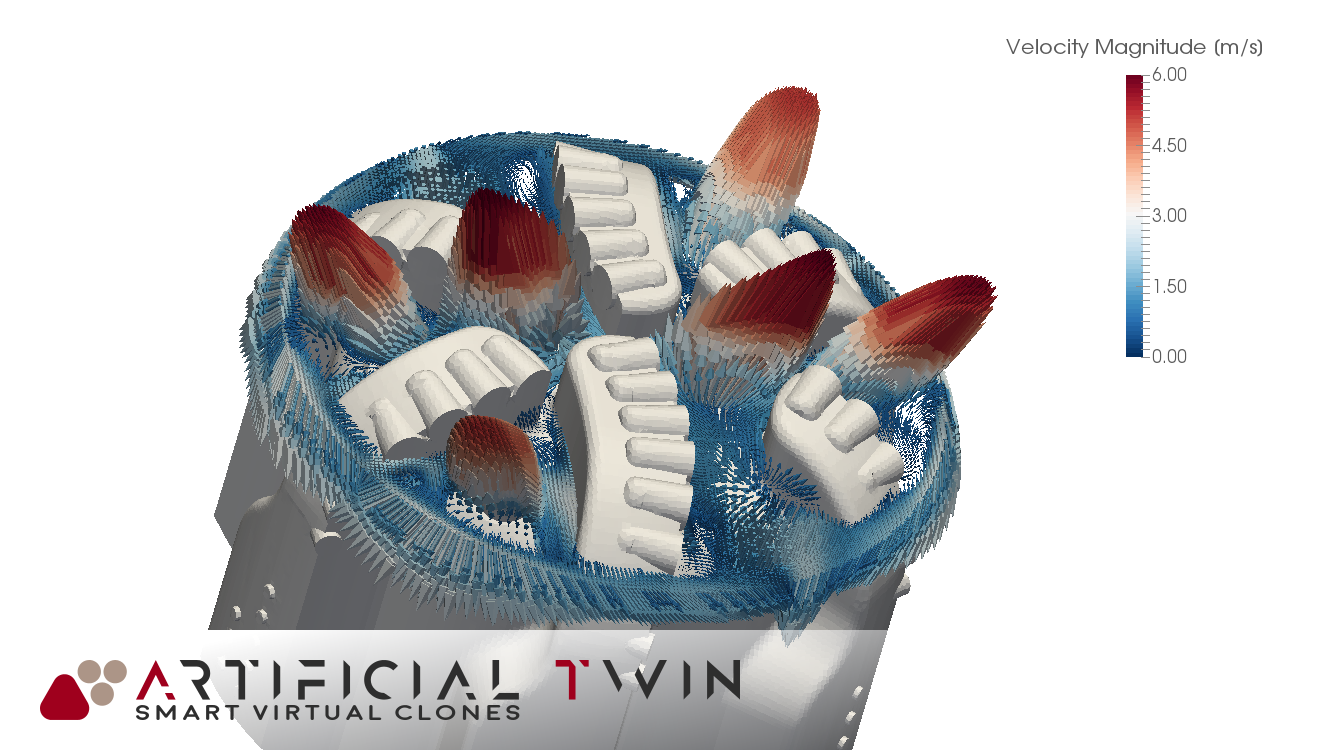
- Glyph vector plot: Arrows showing velocity direction and magnitude by orientation, length, and color.
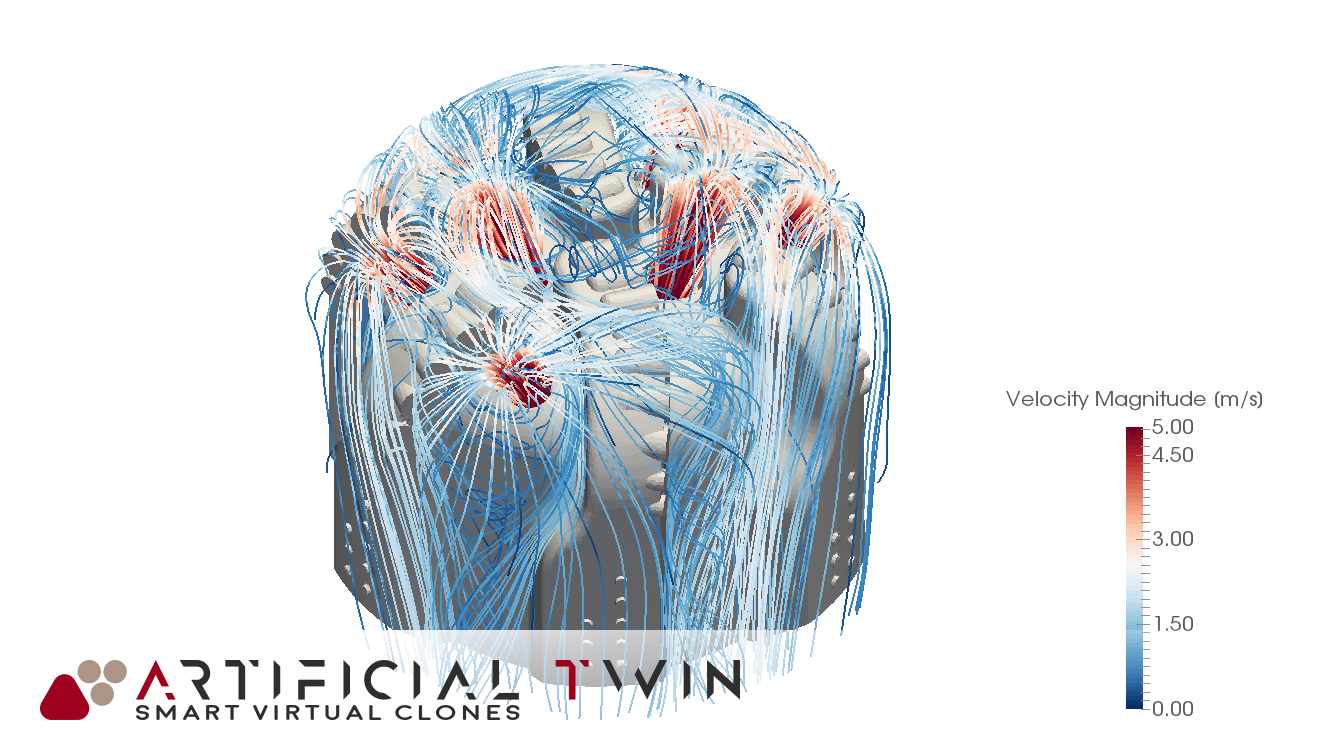
- Streamlines plot: Trajectories of fluid particles colored by local velocity magnitude.
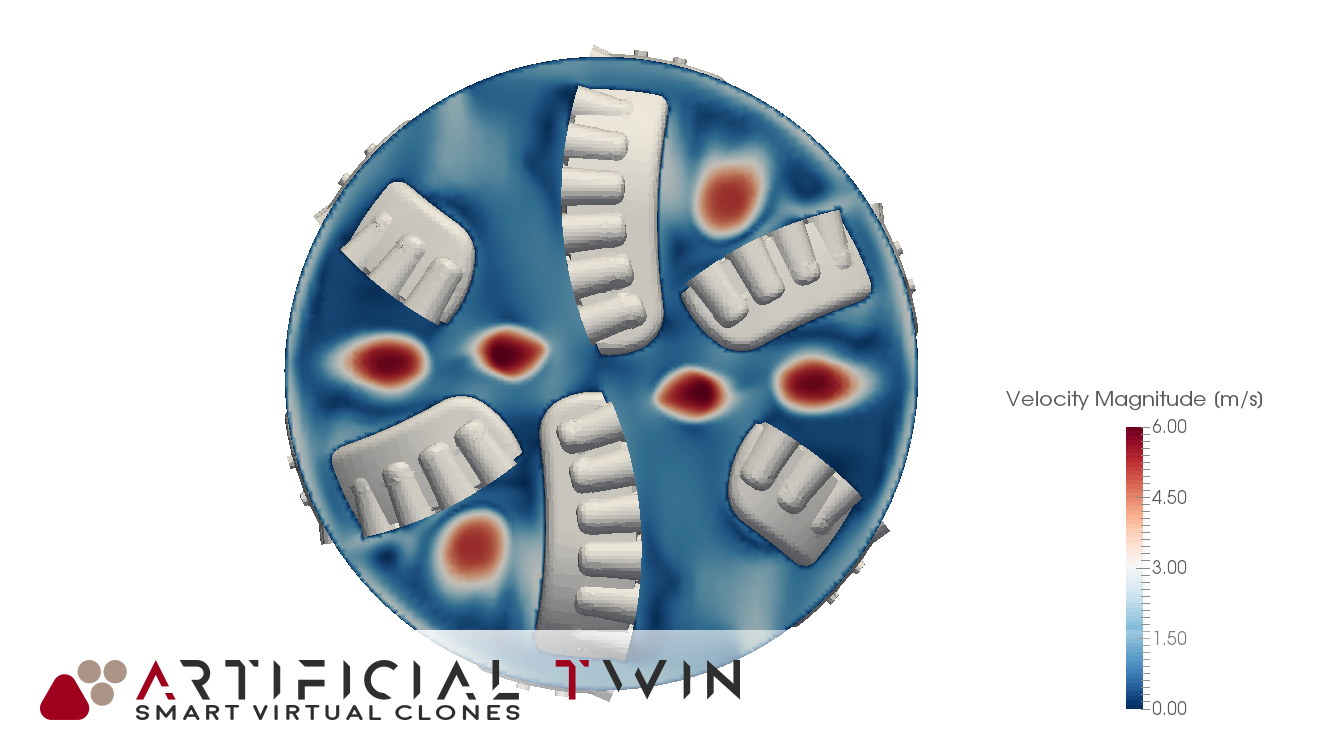
- Contour plot: Color map showing velocity magnitude distribution on a selected cross-section.
These are just a few examples among many available post-processing tools, each suited to different flow phenomena and analysis goals.
More advanced studies
The physics of a drill bit in operation is complex. This study focused on fluid flow around the cutting elements at a given inlet velocity, with flow lines and velocity magnitude being crucial to assess particle removal effectiveness.
More advanced simulations can couple fluid dynamics with solid particle modeling, including rock powder generation by cutting elements. PhyMo supports such studies, enabling deeper insight into particle removal performance.
Virtual simulation tools offer strategic advantages, especially in early design phases, allowing designers to compare multiple solutions without physical prototypes, saving both time and cost. These techniques are applicable across many industries; contact us to explore possibilities for your case.